Farmland Values 2025: Trends In Iowa, Nebraska, South Dakota, and Wyoming

By FCSAmerica Staff

Land Values

 Published on Jul 14, 2025

Farmland values held steady in the first six months of 2025, an indicator of two economic dynamics shaping the U.S. grain industry — solid farm financials tempered by market uncertainty.

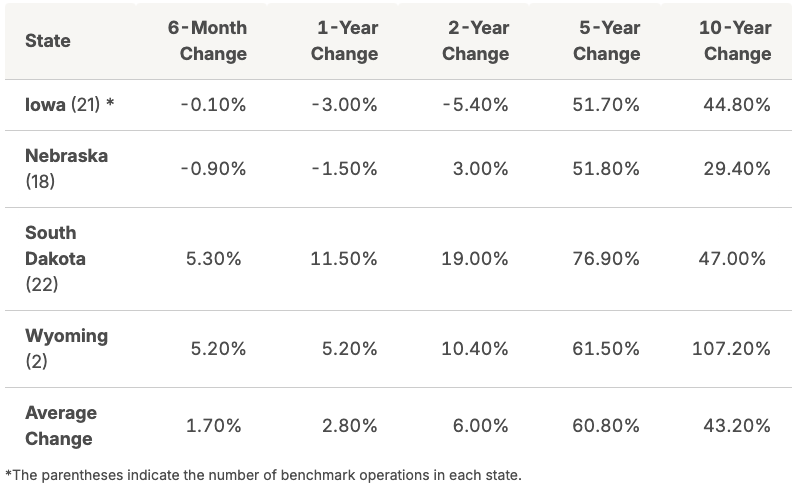
Farm Credit Services of America (FCSAmerica) tracks values on the same 63 benchmark farms every January and July. In the first half of 2025, values were largely flat, increasing an average of 1.70% across Iowa, Nebraska, South Dakota and Wyoming.

Iowa and Nebraska each saw slight declines. This was the second consecutive dip for the two states, although values remain near their record highs. Average farmland values ticked up in South Dakota and Wyoming.

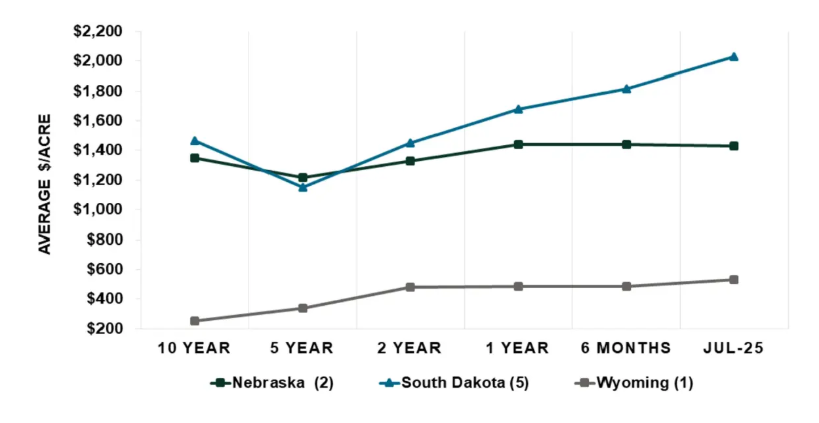
Yearly Farmland Value Trends by State

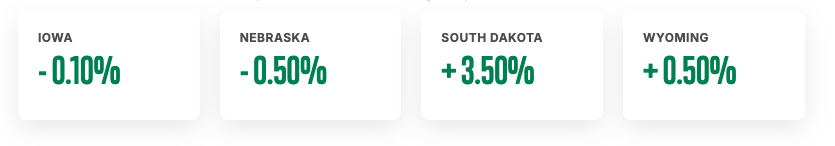
Most benchmarks are cropland, but pasture or a combination of crop and pasture also are included.  Among the cropland benchmarks, Iowa has experienced a decline of -0.10% and -3.60% for the same period in 2025 and 2024, respectively. Nebraska cropland values are down -0.50% since January 1 and -1.20% compared to a year ago.  

South Dakota cropland values have improved 3.50% and 6.20% in the past six and 12 months, respectively, while Wyoming has remained stable, increasing a modest 0.50% during the past year.

Benchmark Cropland Value Changes

6-Month Benchmark Cropland Value Change by State

High beef prices continue to support the pasture market in South Dakota, where benchmark values have risen 14.20% since January and 26.2% compared to a year ago. Wyoming has seen a 9.90% increase during the past year, while Nebraska’s pasture values were unchanged from 12 months ago, when they experienced a modest -1.00% loss. Iowa does not have pasture benchmark farms.

Benchmark Pasture/Ranch Value Changes

6-Month Benchmark Pasture/Ranch Value Changes by State

Continued Local Real Estate Market Volatility

The pockets of volatility in local real estate markets that developed in 2024 continue into 2025, with some sale prices higher than expected and some lower. Tim Koch, executive vice president of business development, said this volatility is to be expected.

Averaged across all sales, prices for Iowa farmland have stabilized; the average second quarter price of $12,445 per acre was slightly above the first quarter of 2025 (sale prices are separate from benchmark farmland values).

By comparison, South Dakota’s near-record average sale price in the first quarter fell 12.6% in the second quarter to $6,767 per acre. Nebraska dryland cropland sold at its lowest price since 2020, finishing the second quarter at $4,060 per acre. This was influenced by productivity of land sold, which fell below historical averages. Irrigated prices dropped 8.3% from the first to second quarter of 2025 for an average of $7,975 per acre.  

Factors Impacting Land Values

While sales activity influences land values, other factors also come into play, helping to cut through noise in the market, Koch said: “The fact that land values are flat and not down tells us that overall, the financial landscape for agriculture is pretty good right now, and this continues to be supportive of real estate values.”

Heading into 2025, some prognosticators expected corn prices to fall to the low $4-, high $3-range, creating financial stress and an increase in fire sales of land.

Instead, corn prices have remained in the mid-$4 range. Producers also received a fresh round of federal farm subsidies earlier this year to offset weather and economic challenges.  

There are pockets of stress, Koch noted, but they remain a small part of the overall economic picture. As a result, land sales due to duress have not impacted the real estate market. In fact, the same tight land market that supported land values for the past several years remains in place. 

Total cropland sales in Iowa tumbled 40.6% in the second quarter compared to the same period in 2024. Dryland cropland sales in Nebraska were largely unchanged, but irrigated land sales declined about 23.8% in the second quarter. South Dakota sales held at 2024 levels.  The state of Wyoming does not require public reporting of land sales, making it difficult to track trends in sales activity.

Challenges and Uncertainty Ahead

Challenges do lie ahead for agriculture, the most immediate being the 2025 corn harvest. Based on current crop conditions and the 95 million acres of U.S. corn hit trendline, farmers could deliver a bumper crop — potentially into a market with fewer buyers.  

So far, the U.S. has found willing buyers for its agricultural products. A weakened dollar and strong demand have helped ease the impact of tariffs and trade disputes. But with the Trump administration threatening more tariffs and trade talks in flux, farmers enter the 2025 harvest in a state of uncertainty. 

“Unlike short-term commodity price swings or isolated financial stress, land values reflect long-term confidence,” he said. “When producers are still willing to invest in farmland, it tells us they believe in the future of the industry. That kind of stability is a grounded, tangible signal of where agriculture really stands.”

But there isn’t a scenario in which land values consistently improve, he noted, and looking ahead to the remainder of 2025, values likely will experience downward pressure. 

Strong Working Capital and Selective Land Investment

Working capital, while well off the record highs of recent years, remains relatively strong. This is largely due to commodity prices staying higher for longer, but also because of additional support from government subsidies, Koch said.  

If commodity prices come under pressure, and that is a possibility, the real estate market will see fewer buyers, he said. Beginning in 2024, buyers already were growing more selective, waiting for the right land in the right location to come on the market and forgoing a growing number of public auctions.

In the first half of 2025, South Dakota saw no-sale public auctions climb to levels last seen in 2017. However, Iowa saw fewer no-sale auctions after the highs of 2023 and 2024. 

Koch said he wouldn’t expect a material shift in land values between now and the end of 2025. But, he added, the market could see a modest shift of a couple points across the board, with anomalies showing up in certain locales based on the quality of land sales.   

To view the full article on the Farm Credit Services of America website, Click Here.

2024 Farmland Values Stable, Market Shows Signs of Downturn

By FCSAmerica Staff

Land Values

 Published on Jan 07, 2025

Farmland values were mostly flat in 2024, holding steady at or near the record highs of recent years. But pockets of volatility in the real estate market in last half of the year signal a changing landscape as grain margins tighten, buyers become increasingly selective and more land auctions end without a sale.

Averaged across the four states served by Farm Credit Services of America (FCSAmerica), land values rose a modest 0.9% in the last half of 2024 and 1.6% for the year.

This slight uptick was largely attributable to one state, South Dakota, where producer balance sheets benefitted from above-average yields. 

Iowa land values, by comparison, declined for the first time in five years. Iowa generally is on the leading edge of trends in the real estate market.

Nebraska’s and Wyoming’s average land values were largely unchanged, although Wyoming market trends are difficult to identify because of limited sales activity. 

FCSAmerica has the longest running and most comprehensive report on agricultural real estate values in its territory. The Association appraises its 63 benchmark farms every six months; many other land values reports are based on surveys. Learn more about how FCSAmerica reports land values.

The table below shows the average change in values for the benchmark farms, dating back to 2014. The parentheses indicate the number of benchmark operations in each state. Most benchmarks are cropland, but pasture or a combination of crop and pasture also are included.  

STATE6-Month1-Year2-Years5-Years10-Years
Iowa (21)-2.80%-5.10%-4.80%52.60%38.60%
Nebraska (18)-0.60%-0.40%7.30%52.80%27.10%
South Dakota (22)5.70%9.50%18.10%64.60%40.50%
Wyoming (2)0.00%2.70%5.90%54.50%110.50%
Average Change (63)0.90%1.60%7.00%56.90%38.30%
Average per-acre $ (63)$8,316$8,551$8,299$5,383$6,399

For the first time, FCSAmerica, AgCountry Farm Credit Services and Frontier Farm Credit have released a joint land values report that includes appraisals for 93 benchmark farms and ranches in all or parts of eight states. The Associations, which operate under a collaboration agreement, update appraisals for their respective benchmark farms every January and July.

6-Month Average Benchmark Land Values Change

In eastern Kansas, land values increased an average of 0.6% and 2.8% in the last half of 2024 and for the year, respectively. Minnesota, North Dakota and Wisconsin, with a combined 17 benchmark farms, saw no to little change during 2024. 

STATE6-Month1-Year2-Years5-Years10-Years
Kansas (7)0.60%2.80%17.00%54.10%52.70%
Minnesota (10)1.60%1.60%4.70%80.90%58.70%
North Dakota (11)0.80%0.80%8.30%73.20%71.40%
Wisconsin (2)0.00%0.00%14.80%30.80%38.00%

Farm Real Estate Market

Today’s real estate market is a changed landscape. Interest rates are more historically normal than a couple of years ago, when rates were near or at record lows. Inflation, while down, has proved stubborn, permanently increasing input costs. And grain prices have declined, squeezing on-farm margins. 

“Balance sheets are tightening as the farm economy enters a down cycle, but producers remain in a good financial position.”
– Tim Koch, executive vice president for business development

Jim Knuth, senior vice president of lending in Iowa, said a softening of land values is to be expected in a compressed-margin environment, recalling that after the ethanol boom of 2012 and 2013, land values dropped for three consecutive years for an overall decline of 22% to 25%.

The surprise as agriculture enters another downturn “is how resilient land values have been.”

“The amount of cash still out there and the strength of balance sheets allow buyers to be both ‘in the market’ and fairly aggressive,” Knuth said. 

Interest rates are not expected to have a significant impact on the market, Koch said. “Margins and availability of capital will play a more crucial role in influencing buyer behavior.”

Signs of a Downturn

While the market is stable overall, Koch noted “instances of significant deviations in sales prices, both above and below expectations.”

Koch noted that while the real estate market currently is stable, “there are indications that we are headed toward a bit of a downturn.”

High quality ground in the right location continued to sell for higher-than-expected prices in 2024. “When it’s a really good farm and two neighbors with money decide they want it,” Koch said, “you still saw farms selling for more than expected.”

The market likely will see pockets of near to record high land sale prices into 2025, he said. But these sales will be the anomaly.

Knuth said buyers also are using appropriate levels of debt to retain adequate working capital for the size, risk and scope of their farm. Rather than an all-cash purchases, today’s buyers tend to invest enough cash to keep their loan payments to a sustainable level


The examples below illustrate the impact that rising interest rates have had on lending decisions.

In both scenarios, the ground costs $10,000 per acre, financing is amortized over 30 years and the buyer wants to keep payments to $300 per acre.

Interest rate:4.0%
Down payment:$4,800
FCSAmerica financing:$5,200
Payment:$300 per acre
Interest rate:7.5%
Down payment:$6,500
FCSAmerica financing:$3,500
Payment:$300 per acre

Cropland vs. Pastureland Values

While profitability is down for grain, the cow-calf industry continues to benefit from strong prices and demand. Values for pasture, in turn, strengthened in some areas in 2024, with South Dakota showing the greatest gain.

FCSAmerica’s benchmark report includes eight pasture ranches and 40 cropland farms. The remaining 22 are a mix of pasture and cropland. 

The graphs below show the changes in values for those operations that are primarily cropland or pasture.

Benchmark Cropland Value Changes

1-Year Benchmark Cropland Value Change by State

Iowa- 6.9%

Nebraska- 0.2%

South Dakota+ 3.6%

Wyoming+ 4.4%

Benchmark Pasture/Ranch Value Changes

1-Year Benchmark Pasture/Ranch Value Changes by State

Nebraska+ 0.4%

South Dakota+ 21.6%

Wyoming+ 1.0%

Farmland Sales and Prices

Land values have benefitted from several years of active buyers competing for limited availability of land. This trend continued into 2024 in much of FCSAmerica’s territory.

However, Koch said, “buyers are increasingly cautious with their working capital, waiting for the right opportunities. This selectivity is driving a reduction in sales, with buyers focusing on high-quality, strategically located land.”

In Iowa and Nebraska, sales were down significantly. Average per-acre sale prices were more of a mixed bag. The state-by-state information below is based on actual land sales data; FCSAmerica reports this information separate from its benchmark farmland report.

Iowa farmland sales: The average price for farmland in 2024 was $12,524 per acre, a drop of 2.66% from 2023. In the fourth quarter alone, the average price for unimproved cropland was $12,320 per acre.

The number of tracts sold at public land auctions – which accounted for 54% of all sales in 2024 – dipped 21% from the previous year. Total sales, including private and realtor, dropped nearly 19%.  

Iowa has seen an uptick in no-sale auctions in the past two years – 5% and 4.5% of all auctions in 2023 and 2024, respectively. This rate of no-sales has not been seen since 2014 and 2015.

Nebraska farmland sales: The average price for dryland cropland in 2024 was $6,914 per acre, an increase of 8% compared to 2023. Sales were down 30.3%. 

The average price for irrigated cropland declined 1.5% to $9,287 per acre. Like dryland, the number of irrigated sales dropped significantly – 30.6% year over year. 

South Dakota farmland sales: The average price for dryland cropland during the fourth quarter of 2024 was $8,215 per acre, the highest average price on record. The average price for the full 12 months was $7,612 per acre, up 8.4% compared to 2023.  

Unlike the other states in FCSAmerica’s territory, sale numbers were more consistent with 2023 – down 1.3% for the year. Public land auctions were up 4% compared to 2023, and accounted for more than 43% of all sales, an all-time high for South Dakota.

Jason Edleman, senior vice president for lending in the state, noted that several factors likely contributed to a significant uptick in auctions in the fourth quarter of 2024, including retirements, concern about higher taxes on proceeds in 2025 and the desire to sell for top dollar and invest it back into ground that better suits their needs. 

“I was talking to one of my financial officers and he said he has three areas of buyers and sellers. You have an auction that gets listed in the newspaper and (potential buyers) are coming to him saying they have to get this piece bought and locked in before the auction because they think the market is going higher.”

“Then there are the buyers at an auction, after which others see a sale price of $12,000 an acre, and they are saying, ‘I am going to sell mine, too.’ Or ‘I’m going to talk to my people who are renting my ground to try to make a sale happen.’ “

Edleman said while producers in many areas of South Dakota busheled through 2024’s lower prices, he expects margins to remain tight, which likely will lead to a softer real estate market in the state. When that happens, he said, public land auctions tend to fall some, and private listings increase. 

To view the full article on the Farm Credit Services of America website. Click here.

Nebraska Ag Land Values Up 5%, Cash Rents Moderating According to 2024 Farm Real Estate Report

Center for Agricultural Profitability
July 1, 2024

Craig Chandler, University Communication.

For the fifth consecutive year, the average all-land value of agricultural land in Nebraska increased, reaching $4,015 per acre in the 12-month period ending Feb. 1, 2024, according to the final report from the University of Nebraska–Lincoln’s 2023-2024 Farm Real Estate Market Survey.

This marks a 5% increase over the prior year and is the highest non-inflation-adjusted statewide land value in the history of the survey. Based on 2024 market values, Nebraska’s estimated total value of agricultural land and buildings rose to approximately $179.2 billion.

The survey’s final report was published June 28 by the university’s Center for Agricultural Profitability, which is based in the Department of Agricultural Economics. It provides current point-in-time estimates of agricultural land values and cash rental rates, broken down regionally across a variety of land types and classes.

Purchases for farm expansion, current livestock prices, and 1031 tax exchanges were identified in the report as the major economic forces that guided the higher market value of land across the state. According to survey results, the amount of land offerings for sale and non-farmer investor interest in land also contributed to higher values.

Inflation pressure continuing from the prior year led many operations to consider investing in assets like land or agricultural equipment, according to Jim Jansen, an agricultural economist with Nebraska Extension. He co-authored the survey and report with Jeffrey Stokes, a professor in the Department of Agricultural Economics.

“Federal Reserve policies to combat inflation have increased borrowing and financing expenses. Higher interest rates influence the cost of short-term lending for annual operating loans and long-term purchases such as farm real estate,” Jansen said. “Rising interest rates might affect the agricultural real estate market without additional profitability to offset the increasing financing expenses.”

“Market participants utilized higher returns on livestock when acquiring different grades of land,” he said, adding that higher long-term interest rates may help moderate Nebraska land values in the future.

Grassland tillable and non-tillable land across the state experienced the highest one-year changes in value, up 7% and 8%, respectively. The value of gravity-irrigated cropland rose by 3%, center pivot-irrigated cropland gained 4%, and the statewide value of dryland cropland rose between 3% and 5%.

The average size of land parcels sold in Nebraska in 2023 was 245 acres, at an average sale price of $4,532 per acre. The highest prices were in the northeast and eastern parts of the state, at $9,341 and $9,723 per acre. The lowest prices per acre were reported in the northwest and north regions, at $1,093 and $1,439 per acre, respectively.

The survey found that cash rental rates for cropland in the state were moderating compared to the prior year, rising between 3% and 5%. Pasture rental rates increased between about 5% and 10% per acre. Cow-calf and stocker monthly rental rates also increased in each of the state’s eight regional districts.

The Nebraska Farm Real Estate Report is the final product of an annual survey of land professionals, including appraisers, farm and ranch managers, and agricultural bankers. Results from the survey are divided by land class and agricultural statistic district. Land values and rental rates presented in the report are averages of survey participants’ responses by district. Actual land values and rental rates may vary depending on the quality of the parcel and local market for an area. Preliminary land values and rental rates are subject to change as additional surveys are returned.

The full report is available on the Center for Agricultural Profitability’s website, https://cap.unl.edu/realeaste.

Tags: 

Land Values

Cash Rents

Nebraska Farm Real Estate Report

Grazing land values up 13% in some parts of Nebraska

  • By Shannon Sand, Nebraska Extension
  • May 8, 2024

By Shannon Sand, Nebraska Extension

It’s that time of year when the preliminary results for Nebraska ag land and rental rates comes out. On average in 2024, the market value for all agricultural land in Nebraska was $4,015 per acre, a 5% increase from the previous year.

Grazing land and hayland market value increases ranged from 6% to 8%. Non-tillable grazing land led the three land classes at 8%.

Districts in the North, East, Southwest and Southeast led the gains ranging from 7% to 13%. For example, non-tillable grazing land in the North averages around $982 per acre, a 13% increase from the previous results. Tillable grazing land followed with an increase of 7%, and hayland experienced a gain of 6%. Cow-calf producers capitalized higher cow-calf prices into these three land classes across competitive areas of the state.

Pasture and cow-calf pair rental rates trended higher across Nebraska in 2024. The rates increased generally between 5% and 8% compared to the previous grazing season. For example, the average per pair rate is $73.95 in the northern part of the state, a 6% change.

Rising grazing land cash rental rates follow higher cattle prices with the decline in national inventories. That may lead people to think about leasing and negotiation.

When negotiating leases some things to think about include early removal provisions when accounting for drought considerations for the upcoming growing season. The degree of service the landlord or tenant provides influences the cow-calf pair rental rates paid as part of the lease. Considerations for the leases include the party responsible for fencing upkeep, control of noxious weeds or brush, and payment of utility bills used for livestock wells.

View the full article here.

Nebraska Farm Real Estate Report

Nebraska Farmland Values and Cash Rental Rates

2023 Final Results

The February 1, 2023, Nebraska all-land average value of $3,835 per acre marks a 14% increase from the prior year. This marks the second-largest increase in the market value of agricultural land since 2014 and the highest non-inflation-adjusted statewide land value in the survey’s history.

Results are published by region and land type below.

2023 Full Report PDF

Previous Years Reports  About the Survey

2023 Survey Highlights

  • The statewide all-land average value for the year ending February 1, 2023, averaged $3,835 per acre, or about a 14% ($475 per acre) increase from the prior year’s value of $3,360 per acre.
  • Rates of increase were the highest in the northeast, east, and southeast districts, as these areas averaged 15% to 17% higher than the all-land average. These districts trended slightly higher than the rate of increase of 14% for the state.
  • Western regions of Nebraska, including the northwest, north, central, southwest, and south districts, reported smaller increases ranging between 10% to 13%. The central district reported the smallest increase at 10%. Overall, increases across the state range from 10% to 17% in 2023.
  • Panel members reported in 2023 that current crop prices, purchases for farm expansion, and non-farmer investor interest in land purchases as major economic forces guiding the market value of land higher across the state. Current crop prices and the financial health of current owners as additional positive forces. 
  • The outlook for future gains in farm real estate values remains relatively strong as only four economic forces were noted as somewhat negatively impacting farm real estate values. Interest rate levels, property tax levels, farm input expenses and future property tax policies were reported as weighing down on the market.
  • Based on 2023 market values, Nebraska’s estimated total value of agricultural land and buildings rose to approximately $191.8 billion. Between 2022 and 2023, the market value increase in agricultural land and buildings totaled about $23.8 billion.

Values by Region

map of Nebraska land values.
Land Type$/Acre%Change
All Land Average3,83514
Center Pivot Irrigated Cropland8,76013
Gravity Irrigated Cropland7,90512
Dryland Cropland (Irrigation Potential)6,07016
Dryland Cropland (No Irrigation Potential)4,39513
Grazing Land (Tillable)1,68014
Grazing Land (Nontillable)1,09015
Hayland2,21017
Due to the inherent limitations of this survey, the information in this report should not be used to set a specific rental rate or value a particular parcel of real property for sale or property taxes, security for a loan, and other related legal matters.

Central

Land Type$/Acre% Change
All Land Average4,21010
Center Pivot Irrigated Cropland8,89510
Gravity Irrigated Cropland7,2353
Dryland Cropland (Irrigation Potential)4,25510
Dryland Cropland (No Irrigation Potential)3,8308
Grazing Land (Tillable)2,62021
Grazing Land (Nontillable)2,03020
Hayland2,60517
Land Type$/Acre% Change
Center Pivot Irrigated Cropland30511
Gravity Irrigated Cropland27010
Dryland Cropland13512
Pasture4613
Land Type$/Month
Cow-Calf Pairs66.70

Counties: Buffalo, Custer, Dawson, Greeley, Hall, Howard, Sherman, Valley

East

Land Type$/Acre% Change
All Land Average9,32015
Center Pivot Irrigated Cropland12,97019
Gravity Irrigated Cropland11,29020
Dryland Cropland (Irrigation Potential)9,53513
Dryland Cropland (No Irrigation Potential)8,36511
Grazing Land (Tillable)4,61518
Grazing Land (Nontillable)2,8655
Hayland3,98015
Land Type$/Acre% Change
Center Pivot Irrigated Cropland3455
Gravity Irrigated Cropland3057
Dryland Cropland2454
Pasture609
Land Type$/Month
Cow-Calf Pairs62.55

Counties: Butler, Cass, Colfax, Dodge, Douglas, Hamilton, Lancaster, Merrick, Nance, Platte, Polk, Sarpy, Saunders, Seward, Washington, York

North

Land Type$/Acre% Change
All Land Average1,45012
Center Pivot Irrigated Cropland5,0654
Gravity Irrigated Cropland4,4556
Dryland Cropland (Irrigation Potential)2,3655
Dryland Cropland (No Irrigation Potential)1,9607
Grazing Land (Tillable)1,55013
Grazing Land (Nontillable)87017
Hayland1,68023
Land Type$/Acre% Change
Center Pivot Irrigated Cropland2405
Gravity Irrigated Cropland2108
Dryland Cropland7617
Pasture3310
Land Type$/Month
Cow-Calf Pairs69.80

Counties: Arthur, Blaine, Boyd, Brown, Cherry, Garfield, Grant, Holt, Hooker, Keya Paha, Logan, Loup, McPherson, Rock, Thomas, Wheeler

Northeast

Land Type$/Acre% Change
All Land Average8,03516
Center Pivot Irrigated Cropland11,71016
Gravity Irrigated Cropland9,8009
Dryland Cropland (Irrigation Potential)8,89019
Dryland Cropland (No Irrigation Potential)7,84513
Grazing Land (Tillable)4,18515
Grazing Land (Nontillable)2,6959
Hayland3,84511
Land Type$/Acre% Change
Center Pivot Irrigated Cropland3657
Gravity Irrigated Cropland3155
Dryland Cropland2659
Pasture724
Land Type$/Month
Cow-Calf Pairs67.35

Counties: Antelope, Boone, Burt, Cedar, Cuming, Dakota, Dixon, Knox, Madison, Pierce, Stanton, Thurston, Wayne

Northwest

Land Type$/Acre% Change
All Land Average93513
Center Pivot Irrigated Cropland3,2807
Gravity Irrigated Cropland2,76010
Dryland Cropland (Irrigation Potential)98515
Dryland Cropland (No Irrigation Potential)90521
Grazing Land (Tillable)73518
Grazing Land (Nontillable)57513
Hayland93012
Land Type$/Acre% Change
Center Pivot Irrigated Cropland1909
Gravity Irrigated Cropland14512
Dryland Cropland3710
Pasture157
Land Type$/Month
Cow-Calf Pairs46.05

Counties: Banner, Box Butte, Cheyenne, Dawes, Deuel, Garden, Kimball, Morrill, Scotts Bluff, Sheridan, Sioux

South

Land Type$/Acre% Change
All Land Average4,85011
Center Pivot Irrigated Cropland8,3708
Gravity Irrigated Cropland7,82014
Dryland Cropland (Irrigation Potential)4,5359
Dryland Cropland (No Irrigation Potential)3,99015
Grazing Land (Tillable)2,59513
Grazing Land (Nontillable)1,6857
Hayland2,2709
Land Type$/Acre% Change
Center Pivot Irrigated Cropland31513
Gravity Irrigated Cropland2606
Dryland Cropland11515
Pasture412
Land Type$/Month
Cow-Calf Pairs56.85

Counties: Adams, Franklin, Furnas, Gosper, Harlan, Kearney, Phelps, Webster

Southeast

Land Type$/Acre% Change
All Land Average7,09017
Center Pivot Irrigated Cropland11,41514
Gravity Irrigated Cropland8,48511
Dryland Cropland (Irrigation Potential)8,11021
Dryland Cropland (No Irrigation Potential)6,42517
Grazing Land (Tillable)3,4606
Grazing Land (Nontillable)2,75010
Hayland3,69518
Land Type$/Acre% Change
Center Pivot Irrigated Cropland3356
Gravity Irrigated Cropland29011
Dryland Cropland2005
Pasture565
Land Type$/Month
Cow-Calf Pairs60.20

Counties: Clay, Fillmore, Gage, Jefferson, Johnson, Nemaha, Nuckolls, Otoe, Pawnee, Richardson, Saline, Thayer

Southwest

Land Type$/Acre% Change
All Land Average2,02512
Center Pivot Irrigated Cropland5,49512
Gravity Irrigated Cropland4,3505
Dryland Cropland (Irrigation Potential)2,08017
Dryland Cropland (No Irrigation Potential)1,72010
Grazing Land (Tillable)1,1509
Grazing Land (Nontillable)94515
Hayland1,75514
Land Type$/Acre% Change
Center Pivot Irrigated Cropland2302
Gravity Irrigated Cropland1959
Dryland Cropland5613
Pasture266
Land Type$/Month
Cow-Calf Pairs58.60

Counties: Chase, Dundy, Frontier, Hayes, Hitchcock, Keith, Lincoln, Perkins, Red Willow

About the Nebraska Farm Real Estate Market Survey

The Nebraska Farm Real Estate Market Survey is an annual survey of land professionals, including appraisers, farm and ranch managers, and agricultural bankers. It is conducted by the Center for Agricultural Profitability, which is based in the Department of Agricultural Economics at the University of Nebraska-Lincoln. Results from the survey are divided by land class and agricultural statistic district. Land values and rental rates presented in the report are averages of survey participants’ responses by district. Actual land values and rental rates may vary depending upon the quality of the parcel and local market for an area. Preliminary land values and rental rates are subject to change as additional surveys are returned.

Click here to read the full article on the University of Nebraska Lincoln website.

Nebraska Ag Land Values Up 16%

Farm Real Estate Survey: Nebraska Ag Land Values Up 16%, Cash Rental Rates Updated
Ryan Evans
Center for Agricultural Profitability
March 16, 2022

Source: Institute of Agriculture and Natural Resources | Agricultural Economics
CENTER FOR AGRICULTURAL PROFITABILITY

See the full article on the University of Nebraska-Lincoln website: https://cap.unl.edu/land/farm-real-estate-survey-nebraska-ag-land-values-16-cash-rental-rates-updated

Aerial shot of farmland.
Corn and soybean fields in the final stages before harvest create a patchwork of colors at sunset bisected by Highway 43 in southeast Lancaster County. September 26, 2021. Photo by Craig Chandler / University Communication.

The value of agricultural land in Nebraska increased by an average of 16% over the prior year, to a statewide average of $3,360 per acre, according to the preliminary findings of the University of Nebraska–Lincoln’s 2022 Farm Real Estate Market Survey. This marks the largest increase in the market value of agricultural land in the state since 2014 and is the highest non-inflation-adjusted statewide land value in the history of the survey.

According to the survey, higher commodity prices and interest rates near historic lows have contributed to the recent robust real estate sales market. Survey participants also reported that those purchasing land looked to the asset as a hedge against inflation and economic uncertainty.

“Many operations improved their financial positions in the last year, despite rising machinery costs and input expenses,” said Jim Jansen, an agricultural economist with Nebraska Extension who co-authored the survey and report with Jeffrey Stokes, a professor in the Department of Agricultural Economics.

Jansen noted that the outlook for 2022 appears favorable, as commodity prices continue to rise, but cautioned against rising input expenses and concerns about drought across Nebraska.

land values map.

Statewide, the preliminary report found that estimated values of center pivot-irrigated cropland rose by about 17%. Dryland cropland values rose between 15% and 19%. Grazing land and hayland market values range from about 10% to 13% higher than the prior year.

Survey results also revealed that cash rental rates for dryland and irrigated cropland trended higher, averaging about 10% to 15% higher than the prior year. Survey participants indicated crop prices as the major factor contributing to the increase in rental rates.

Grazing land and cow-calf pair rental rates trended steady to higher, with average statewide rates increasing about 6% to 8% over the prior year.

The Nebraska Farm Real Estate Market Survey is an annual survey of land professionals, including appraisers, farm and ranch managers, and agricultural bankers. It is conducted by the Center for Agricultural Profitability, based in the Department of Agricultural Economics. Results from the survey are divided by land class and agricultural statistic district. Land values and rental rates presented in the report are averages of survey participants’ responses by district. Actual land values and rental rates may vary depending on the quality of the parcel and local market for an area. Preliminary land values and rental rates are subject to change as additional surveys are returned.

The preliminary report was released in the Department of Agricultural Economics’ weekly Cornhusker Economics newsletter on March 16. Its findings will be discussed during a pair of virtual landlord/tenant cash rent workshops that will be held on March 24 and 25. To register for the workshops and read the report, click here. Final results from the survey are expected to be published in June.

Farmland Values Soar Despite Pandemic

LOW INTEREST RATES AND THE STRONG FARM ECONOMY SUPPORTED THE RISE IN LAND VALUE, SAID THE KANSAS CITY BANK.

By Chuck Abbott8/13/2021

Fueled by strong commodity prices and continued pandemic assistance, farmland values are skyrocketing, up by 14% in the central Midwest and by 10% in the central Plains, said the Federal Reserve banks in Chicago and Kansas City on Thursday. “Government payments have buoyed the agricultural sector,” said an Illinois farm banker surveyed by the Chicago Fed.

“Farmland values for the Seventh District climbed 14% on a year-over-year basis in the second quarter of 2021 — their largest such gain in eight years,” said the Chicago Fed in its quarterly Ag Letter. “Values are expected to rise again during the third quarter of the year.”

The Kansas City Fed said farm income had grown at a fast pace from a year ago, thanks to “a sharp turnaround in agricultural economic conditions and lasting support from government programs related to pandemic relief.” Although farmers and ranchers face higher production costs, the opportunity for profit is strong. “Despite potential headwinds, bankers indicated they expected improvements in farm income and credit conditions to continue in the months ahead.”

Low interest rates and the strong farm economy supported the rise in land value, said the Kansas City bank. “The value of all types of land throughout the district was about 10% higher than a year ago, the largest increase since 2013.”

Ag lenders in Colorado and Wyoming said drought has challenged producers this summer. A banker in Oklahoma said, “The increase in land values is making it difficult for both crop and livestock producers to afford purchasing based on the amount of return they generate from production.”

While most bankers in the Chicago Fed district were optimistic about the farm sector in the near term, some were less sanguine about the longer term, given uncertainties about the pandemic, export markets, input costs, and federal support. “High commodity prices, solid yields, and PPP loans have sharply improved farmers’ finances. However, long-term risks are of serious concern,” commented one lender.

Yes you can buy farmland with your IRA

Many farmers are surprised to learn you can buy farmland with an Individual Retirement Account.

Mike Downey | Apr 15, 2021

Source: Farm Futures – See the full article on their website. https://www.farmprogress.com/commentary/yes-you-can-buy-farmland-your-ira

Most people I work with own farmland, and many of them also own some type of retirement IRA. In transition planning, there is also a financial component to review what the income sources are during retirement.

There is no doubt retirement funds invested in the stock market have performed very well over the last decade. However, as retirement nears the mindset about the stock market often changes and causes some to question whether there are other investment alternatives available for their funds. 

‘I wish I could buy a farm with my IRA’

This is a common expression I hear. Farmers and landowners are comfortable with farmland and how it works. Farmland is also a long-term, stable investment which has historically appreciated in value.

Many don’t realize you can actually buy a farm with your IRA.

The IRS has allowed for the investment in farmland by your IRA since they were first introduced in 1974. So, why isn’t this better understood? One of the reasons is most of the typical IRA providers do not offer the option to invest in alternative investments such as farmland, only traditional investments such as stocks, bonds, and mutual funds. In fact, you must be a qualified custodian, administrator, or facilitator to offer these alternative investment classes which are now becoming more popular. This is an opportunity to self-direct and diversify all or a portion of your retirement funds away from Wall Street and into more private investment sources.   

Self-directed IRA

The first step is to open an account and roll all or a portion of your existing IRA to a self-directed IRA. Then, you advise your custodian or administrator which tract of farmland you wish to purchase. There are definitely some do’s and don’ts however:

Prohibited transactions. First, you cannot gain personal benefit or operate the farmland yourself. In other words, no self-dealing and the transactions must be arms-length in nature. You can buy, sell, and lease the farmland to anyone except for disqualified persons; they include you and your spouse, and any direct lineal descendants up and down your family tree (parents, children, grandchildren). However, buying, selling, or leasing to a sibling, cousin, extended family member, or neighbor, is acceptable. All revenues and expenses must flow to and from your self-directed IRA account and you cannot touch the monies personally. The investment must benefit your IRA, not you personally.   

Tax advantages. Just like other IRAs, a self-directed IRA shelters income tax as the income from the investment grows tax-deferred (Traditional IRA) or tax free (Roth IRA). The sale of a farm is also not subject to capital gains tax treatment. So, you can buy, sell, or trade farmland inside your self-directed IRA under no time restraints or concern over capital gains.

A self-directed Roth IRA (tax free growth), in addition to being exempt from capital gain tax on the sale of the investment, is a powerful combination from a tax standpoint.

Example: I buy 80 acres with my self-directed Roth IRA. The transaction is arms-length and all monies flow to and from my IRA account. Since I already paid the income tax when I contributed the funds to the Roth account, all income, appreciation, and capital gains grow tax free inside the account. With a Traditional IRA, I would be required to take minimum distributions (RMD’s) and pay the respective income tax beginning at the age of 72. However, RMD’s are not required with a Roth IRA; but if I elect to take distributions, they are tax free.

Is it too good to be true

Yes, it is legal to own farmland and other alternative investments with your IRA. There are also tax and legal advisors who may scrutinize it, just as your current financial advisor no doubt will. As with any investment, be sure to work with qualified individuals who specialize in this area and are familiar with the laws in your individual state. Otherwise, please know there are other investment alternatives available for your IRA if the future unknown of the stock market concerns you. 

Rural Bankers: Farmland Prices Hit Highest Level Since 2012

Source: AgWeb Farm Journal

By SARA SCHAFER April 15, 2021

Optimism is spouting in many areas of the rural economy. While the Rural Mainstreet Index (RMI) dipped from March’s record high of 71.9, economic growth is still occurring in rural America.

For April 2021, the index sits at 69, marking the sixth straight month the RMI has remained above growth neutral. The index ranges between 0 and 100, with 50 representing growth neutral. 

Around 40% of bank CEOs reported their local economy expanded between March and April.

“Strong growth in grain prices, the Federal Reserve’s record-low interest rates and growing exports have underpinned the Rural Mainstreet Economy,” reports Ernie Goss, who chairs Creighton’s Heider College of Business and leads the RMI. “Even so, current rural economic activity remains below pre-pandemic levels.”

The highlight of the report is the farmland price index. For a seventh straight month, it has advanced above growth neutral. The April reading climbed to 78.6 — the highest level since 2012, and up from 71.9 in March. This is first time since 2013 that farmland price index has posted seven straight months of above-neutral growth.

The farmland price index rose in each state included in the RMI. Nebraska claims the highest farmland price index with 82.6. That’s up from last month’s 76.1.

Farmland Index

Bankers reported 9% of farmland sales over past six months have gone to non-farmer investors.   

Farmland Investments - RMO

The April farm equipment sales index rose to 67.5, its highest level since 2013. That’s up from March’s strong 63.5. After 86 straight months of readings below growth neutral, farm equipment sales bounced into growth territory for the last five months.    

The confidence index, which reflects bank CEO expectations for the economy six months out, fell to a very healthy 72.4 from 76.7 in March. 

“Federal stimulus checks, improving gain prices and advancing exports have supported confidence offsetting negatives from pandemic ravaged retail and leisure and hospitality companies in the rural economy,” Goss says.

This RMI, which started in 2005, represents an early snapshot of the economy of rural agricultural and energy-dependent portions of the nation. It focuses on 200 rural communities in a 10-state region with an average population of 1,300. 

To read the full article on their website go to: https://www.agweb.com/news/business/farmland/rural-bankers-farmland-prices-hit-highest-level-2012