It’s that time of year when the preliminary results for Nebraska ag land and rental rates comes out. On average in 2024, the market value for all agricultural land in Nebraska was $4,015 per acre, a 5% increase from the previous year.
Grazing land and hayland market value increases ranged from 6% to 8%. Non-tillable grazing land led the three land classes at 8%.
Districts in the North, East, Southwest and Southeast led the gains ranging from 7% to 13%. For example, non-tillable grazing land in the North averages around $982 per acre, a 13% increase from the previous results. Tillable grazing land followed with an increase of 7%, and hayland experienced a gain of 6%. Cow-calf producers capitalized higher cow-calf prices into these three land classes across competitive areas of the state.
Pasture and cow-calf pair rental rates trended higher across Nebraska in 2024. The rates increased generally between 5% and 8% compared to the previous grazing season. For example, the average per pair rate is $73.95 in the northern part of the state, a 6% change.
Rising grazing land cash rental rates follow higher cattle prices with the decline in national inventories. That may lead people to think about leasing and negotiation.
When negotiating leases some things to think about include early removal provisions when accounting for drought considerations for the upcoming growing season. The degree of service the landlord or tenant provides influences the cow-calf pair rental rates paid as part of the lease. Considerations for the leases include the party responsible for fencing upkeep, control of noxious weeds or brush, and payment of utility bills used for livestock wells.
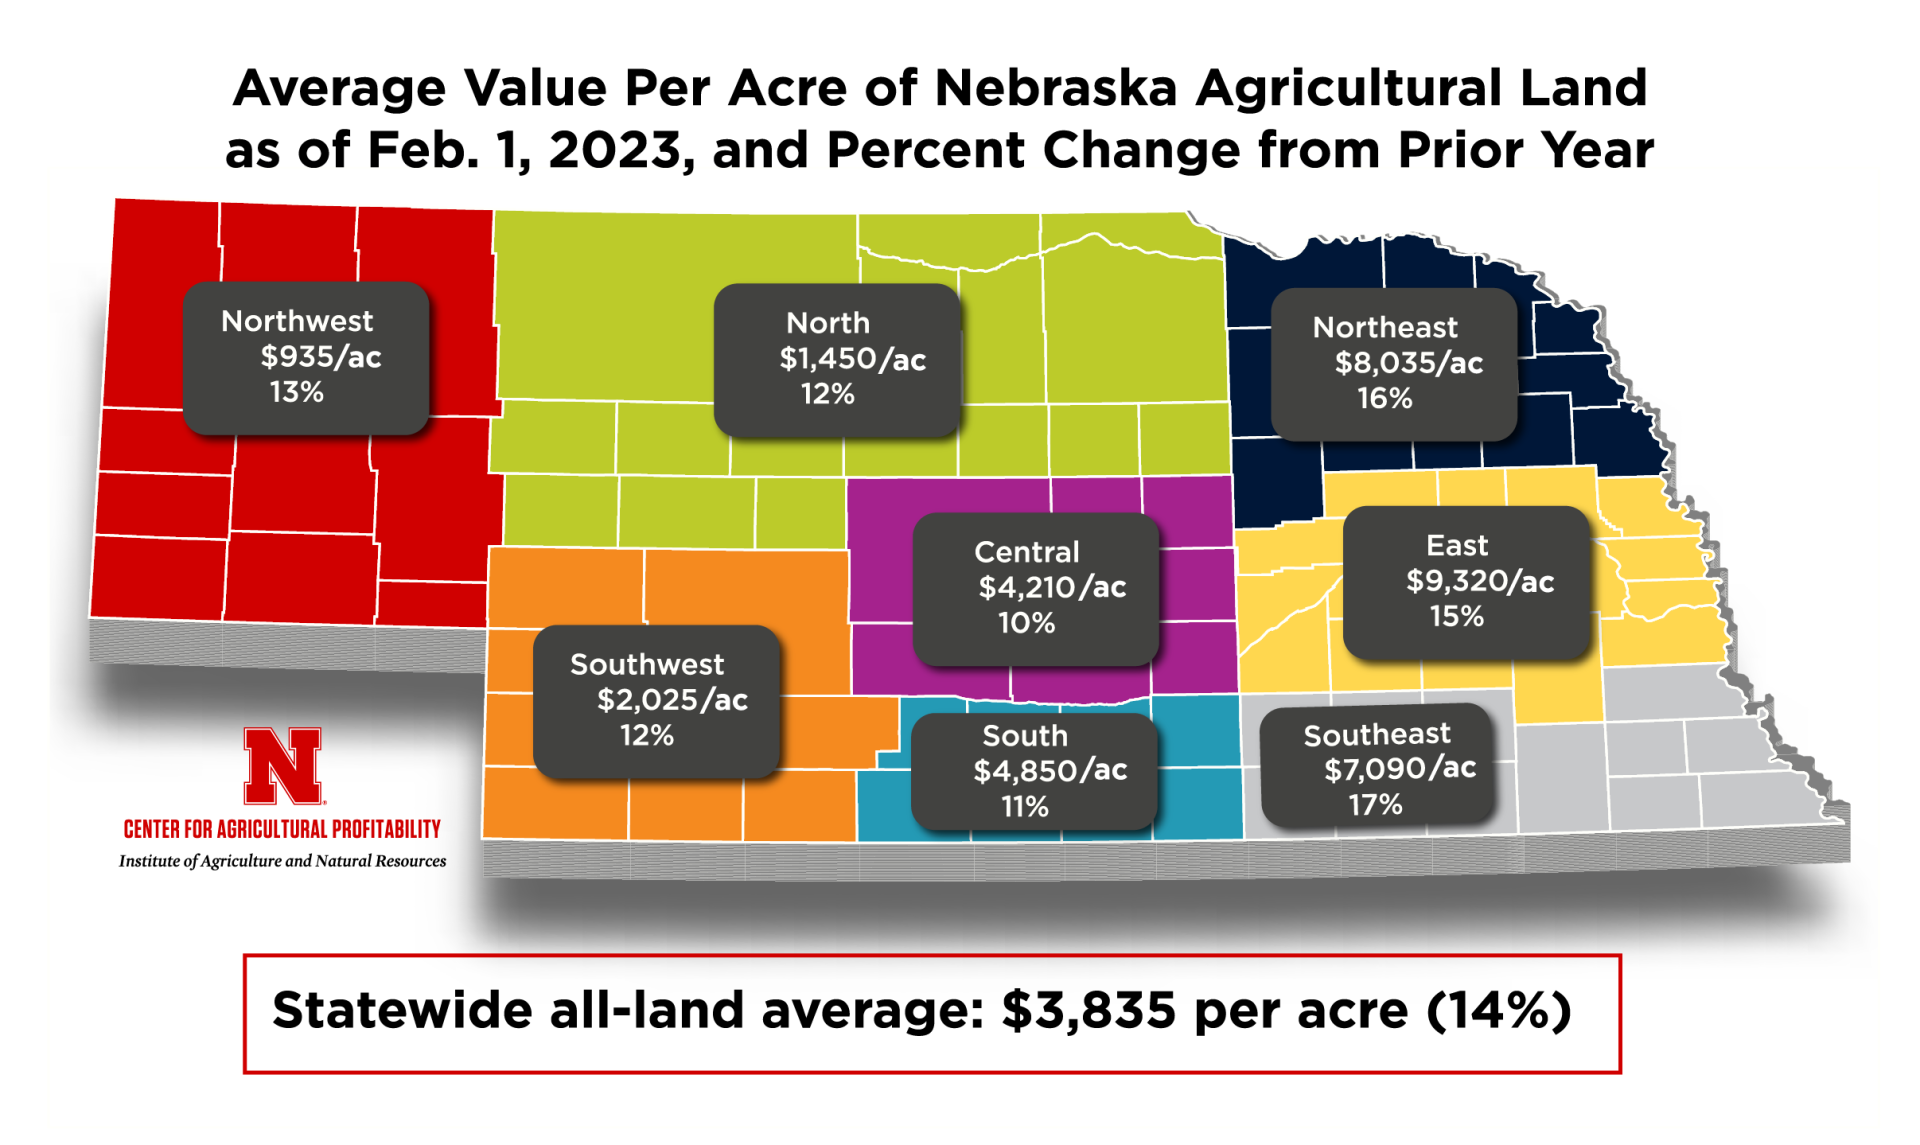
The February 1, 2023, Nebraska all-land average value of $3,835 per acre marks a 14% increase from the prior year. This marks the second-largest increase in the market value of agricultural land since 2014 and the highest non-inflation-adjusted statewide land value in the survey’s history.
Results are published by region and land type below.
The statewide all-land average value for the year ending February 1, 2023, averaged $3,835 per acre, or about a 14% ($475 per acre) increase from the prior year’s value of $3,360 per acre.
Rates of increase were the highest in the northeast, east, and southeast districts, as these areas averaged 15% to 17% higher than the all-land average. These districts trended slightly higher than the rate of increase of 14% for the state.
Western regions of Nebraska, including the northwest, north, central, southwest, and south districts, reported smaller increases ranging between 10% to 13%. The central district reported the smallest increase at 10%. Overall, increases across the state range from 10% to 17% in 2023.
Panel members reported in 2023 that current crop prices, purchases for farm expansion, and non-farmer investor interest in land purchases as major economic forces guiding the market value of land higher across the state. Current crop prices and the financial health of current owners as additional positive forces.
The outlook for future gains in farm real estate values remains relatively strong as only four economic forces were noted as somewhat negatively impacting farm real estate values. Interest rate levels, property tax levels, farm input expenses and future property tax policies were reported as weighing down on the market.
Based on 2023 market values, Nebraska’s estimated total value of agricultural land and buildings rose to approximately $191.8 billion. Between 2022 and 2023, the market value increase in agricultural land and buildings totaled about $23.8 billion.
Values by Region
Land Type
$/Acre
%Change
All Land Average
3,835
14
Center Pivot Irrigated Cropland
8,760
13
Gravity Irrigated Cropland
7,905
12
Dryland Cropland (Irrigation Potential)
6,070
16
Dryland Cropland (No Irrigation Potential)
4,395
13
Grazing Land (Tillable)
1,680
14
Grazing Land (Nontillable)
1,090
15
Hayland
2,210
17
Due to the inherent limitations of this survey, the information in this report should not be used to set a specific rental rate or value a particular parcel of real property for sale or property taxes, security for a loan, and other related legal matters.
Central
Land Type
$/Acre
% Change
All Land Average
4,210
10
Center Pivot Irrigated Cropland
8,895
10
Gravity Irrigated Cropland
7,235
3
Dryland Cropland (Irrigation Potential)
4,255
10
Dryland Cropland (No Irrigation Potential)
3,830
8
Grazing Land (Tillable)
2,620
21
Grazing Land (Nontillable)
2,030
20
Hayland
2,605
17
Land Type
$/Acre
% Change
Center Pivot Irrigated Cropland
305
11
Gravity Irrigated Cropland
270
10
Dryland Cropland
135
12
Pasture
46
13
Land Type
$/Month
Cow-Calf Pairs
66.70
Counties: Buffalo, Custer, Dawson, Greeley, Hall, Howard, Sherman, Valley
The Nebraska Farm Real Estate Market Survey is an annual survey of land professionals, including appraisers, farm and ranch managers, and agricultural bankers. It is conducted by the Center for Agricultural Profitability, which is based in the Department of Agricultural Economics at the University of Nebraska-Lincoln. Results from the survey are divided by land class and agricultural statistic district. Land values and rental rates presented in the report are averages of survey participants’ responses by district. Actual land values and rental rates may vary depending upon the quality of the parcel and local market for an area. Preliminary land values and rental rates are subject to change as additional surveys are returned.
Click here to read the full article on the University of Nebraska Lincoln website.
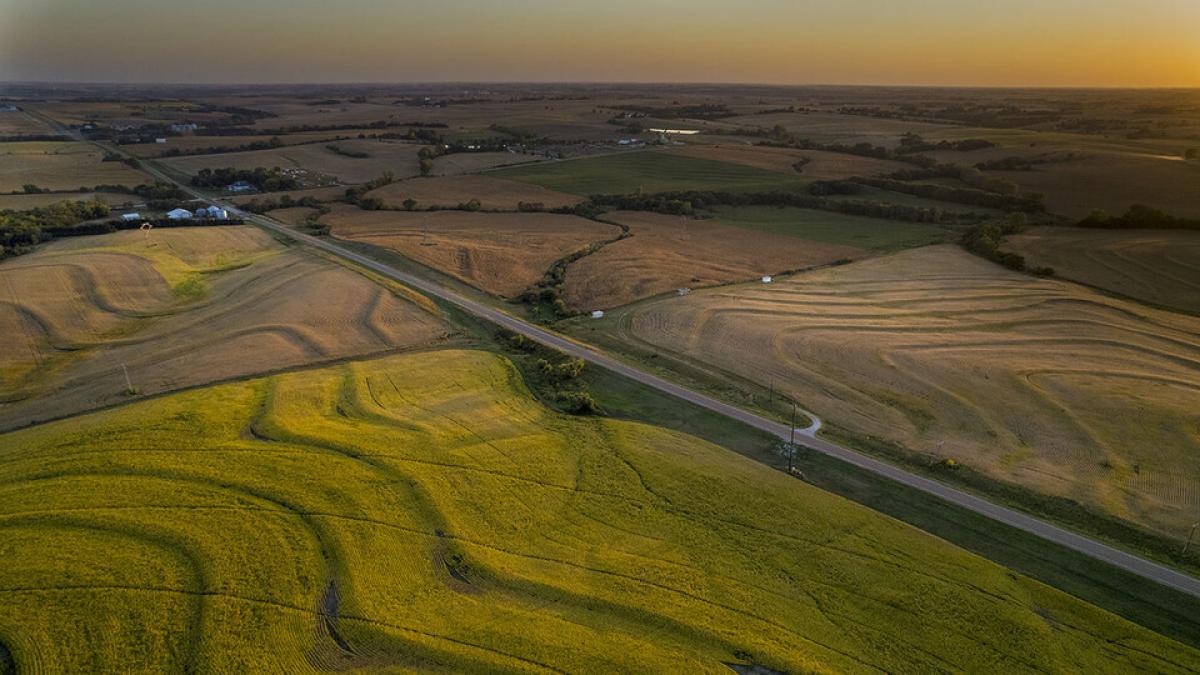
Corn and soybean fields in the final stages before harvest create a patchwork of colors at sunset bisected by Highway 43 in southeast Lancaster County. September 26, 2021. Photo by Craig Chandler / University Communication.
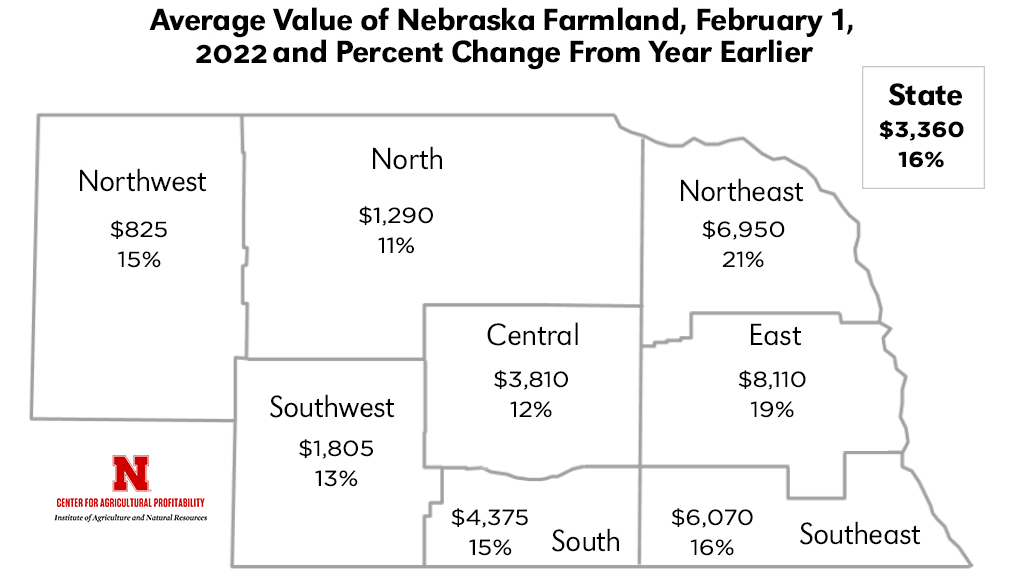
The value of agricultural land in Nebraska increased by an average of 16% over the prior year, to a statewide average of $3,360 per acre, according to the preliminary findings of the University of Nebraska–Lincoln’s 2022 Farm Real Estate Market Survey. This marks the largest increase in the market value of agricultural land in the state since 2014 and is the highest non-inflation-adjusted statewide land value in the history of the survey.
According to the survey, higher commodity prices and interest rates near historic lows have contributed to the recent robust real estate sales market. Survey participants also reported that those purchasing land looked to the asset as a hedge against inflation and economic uncertainty.
“Many operations improved their financial positions in the last year, despite rising machinery costs and input expenses,” said Jim Jansen, an agricultural economist with Nebraska Extension who co-authored the survey and report with Jeffrey Stokes, a professor in the Department of Agricultural Economics.
Jansen noted that the outlook for 2022 appears favorable, as commodity prices continue to rise, but cautioned against rising input expenses and concerns about drought across Nebraska.
Statewide, the preliminary report found that estimated values of center pivot-irrigated cropland rose by about 17%. Dryland cropland values rose between 15% and 19%. Grazing land and hayland market values range from about 10% to 13% higher than the prior year.
Survey results also revealed that cash rental rates for dryland and irrigated cropland trended higher, averaging about 10% to 15% higher than the prior year. Survey participants indicated crop prices as the major factor contributing to the increase in rental rates.
Grazing land and cow-calf pair rental rates trended steady to higher, with average statewide rates increasing about 6% to 8% over the prior year.
The Nebraska Farm Real Estate Market Survey is an annual survey of land professionals, including appraisers, farm and ranch managers, and agricultural bankers. It is conducted by the Center for Agricultural Profitability, based in the Department of Agricultural Economics. Results from the survey are divided by land class and agricultural statistic district. Land values and rental rates presented in the report are averages of survey participants’ responses by district. Actual land values and rental rates may vary depending on the quality of the parcel and local market for an area. Preliminary land values and rental rates are subject to change as additional surveys are returned.
The preliminary report was released in the Department of Agricultural Economics’ weekly Cornhusker Economics newsletter on March 16. Its findings will be discussed during a pair of virtual landlord/tenant cash rent workshops that will be held on March 24 and 25. To register for the workshops and read the report, click here. Final results from the survey are expected to be published in June.
Fueled by strong commodity prices and continued pandemic assistance, farmland values are skyrocketing, up by 14% in the central Midwest and by 10% in the central Plains, said the Federal Reserve banks in Chicago and Kansas City on Thursday. “Government payments have buoyed the agricultural sector,” said an Illinois farm banker surveyed by the Chicago Fed.
“Farmland values for the Seventh District climbed 14% on a year-over-year basis in the second quarter of 2021 — their largest such gain in eight years,” said the Chicago Fed in its quarterly Ag Letter. “Values are expected to rise again during the third quarter of the year.”
The Kansas City Fed said farm income had grown at a fast pace from a year ago, thanks to “a sharp turnaround in agricultural economic conditions and lasting support from government programs related to pandemic relief.” Although farmers and ranchers face higher production costs, the opportunity for profit is strong. “Despite potential headwinds, bankers indicated they expected improvements in farm income and credit conditions to continue in the months ahead.”
Low interest rates and the strong farm economy supported the rise in land value, said the Kansas City bank. “The value of all types of land throughout the district was about 10% higher than a year ago, the largest increase since 2013.”
Ag lenders in Colorado and Wyoming said drought has challenged producers this summer. A banker in Oklahoma said, “The increase in land values is making it difficult for both crop and livestock producers to afford purchasing based on the amount of return they generate from production.”
While most bankers in the Chicago Fed district were optimistic about the farm sector in the near term, some were less sanguine about the longer term, given uncertainties about the pandemic, export markets, input costs, and federal support. “High commodity prices, solid yields, and PPP loans have sharply improved farmers’ finances. However, long-term risks are of serious concern,” commented one lender.
Most people I work with own farmland, and many of them also own some type of retirement IRA. In transition planning, there is also a financial component to review what the income sources are during retirement.
There is no doubt retirement funds invested in the stock market have performed very well over the last decade. However, as retirement nears the mindset about the stock market often changes and causes some to question whether there are other investment alternatives available for their funds.
‘I wish I could buy a farm with my IRA’
This is a common expression I hear. Farmers and landowners are comfortable with farmland and how it works. Farmland is also a long-term, stable investment which has historically appreciated in value.
Many don’t realize you can actually buy a farm with your IRA.
The IRS has allowed for the investment in farmland by your IRA since they were first introduced in 1974. So, why isn’t this better understood? One of the reasons is most of the typical IRA providers do not offer the option to invest in alternative investments such as farmland, only traditional investments such as stocks, bonds, and mutual funds. In fact, you must be a qualified custodian, administrator, or facilitator to offer these alternative investment classes which are now becoming more popular. This is an opportunity to self-direct and diversify all or a portion of your retirement funds away from Wall Street and into more private investment sources.
Self-directed IRA
The first step is to open an account and roll all or a portion of your existing IRA to a self-directed IRA. Then, you advise your custodian or administrator which tract of farmland you wish to purchase. There are definitely some do’s and don’ts however:
Prohibited transactions. First, you cannot gain personal benefit or operate the farmland yourself. In other words, no self-dealing and the transactions must be arms-length in nature. You can buy, sell, and lease the farmland to anyone except for disqualified persons; they include you and your spouse, and any direct lineal descendants up and down your family tree (parents, children, grandchildren). However, buying, selling, or leasing to a sibling, cousin, extended family member, or neighbor, is acceptable. All revenues and expenses must flow to and from your self-directed IRA account and you cannot touch the monies personally. The investment must benefit your IRA, not you personally.
Tax advantages. Just like other IRAs, a self-directed IRA shelters income tax as the income from the investment grows tax-deferred (Traditional IRA) or tax free (Roth IRA). The sale of a farm is also not subject to capital gains tax treatment. So, you can buy, sell, or trade farmland inside your self-directed IRA under no time restraints or concern over capital gains.
A self-directed Roth IRA (tax free growth), in addition to being exempt from capital gain tax on the sale of the investment, is a powerful combination from a tax standpoint.
Example: I buy 80 acres with my self-directed Roth IRA. The transaction is arms-length and all monies flow to and from my IRA account. Since I already paid the income tax when I contributed the funds to the Roth account, all income, appreciation, and capital gains grow tax free inside the account. With a Traditional IRA, I would be required to take minimum distributions (RMD’s) and pay the respective income tax beginning at the age of 72. However, RMD’s are not required with a Roth IRA; but if I elect to take distributions, they are tax free.
Is it too good to be true
Yes, it is legal to own farmland and other alternative investments with your IRA. There are also tax and legal advisors who may scrutinize it, just as your current financial advisor no doubt will. As with any investment, be sure to work with qualified individuals who specialize in this area and are familiar with the laws in your individual state. Otherwise, please know there are other investment alternatives available for your IRA if the future unknown of the stock market concerns you.
Optimism is spouting in many areas of the rural economy. While the Rural Mainstreet Index (RMI) dipped from March’s record high of 71.9, economic growth is still occurring in rural America.
For April 2021, the index sits at 69, marking the sixth straight month the RMI has remained above growth neutral. The index ranges between 0 and 100, with 50 representing growth neutral.
Around 40% of bank CEOs reported their local economy expanded between March and April.
“Strong growth in grain prices, the Federal Reserve’s record-low interest rates and growing exports have underpinned the Rural Mainstreet Economy,” reports Ernie Goss, who chairs Creighton’s Heider College of Business and leads the RMI. “Even so, current rural economic activity remains below pre-pandemic levels.”
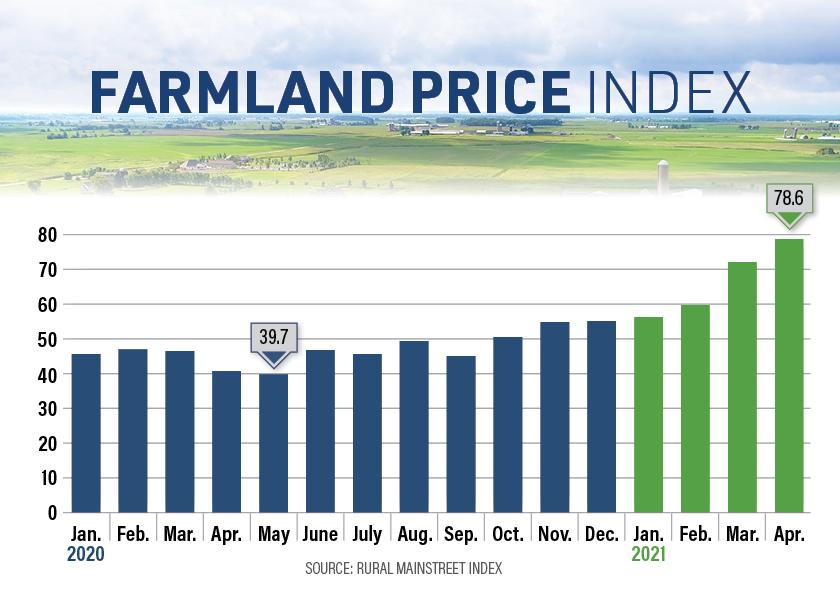
The highlight of the report is the farmland price index. For a seventh straight month, it has advanced above growth neutral. The April reading climbed to 78.6 — the highest level since 2012, and up from 71.9 in March. This is first time since 2013 that farmland price index has posted seven straight months of above-neutral growth.
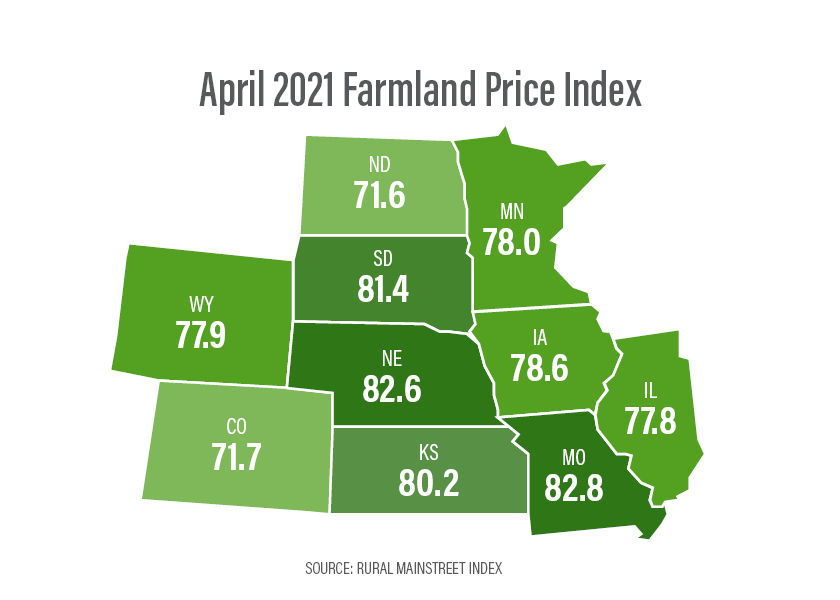
The farmland price index rose in each state included in the RMI. Nebraska claims the highest farmland price index with 82.6. That’s up from last month’s 76.1.
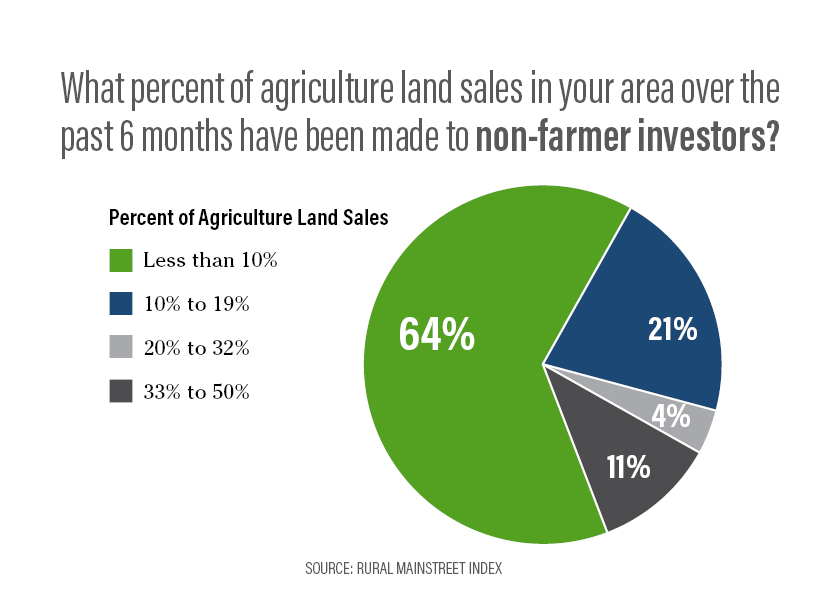
Bankers reported 9% of farmland sales over past six months have gone to non-farmer investors.
The April farm equipment sales index rose to 67.5, its highest level since 2013. That’s up from March’s strong 63.5. After 86 straight months of readings below growth neutral, farm equipment sales bounced into growth territory for the last five months.
The confidence index, which reflects bank CEO expectations for the economy six months out, fell to a very healthy 72.4 from 76.7 in March.
“Federal stimulus checks, improving gain prices and advancing exports have supported confidence offsetting negatives from pandemic ravaged retail and leisure and hospitality companies in the rural economy,” Goss says.
This RMI, which started in 2005, represents an early snapshot of the economy of rural agricultural and energy-dependent portions of the nation. It focuses on 200 rural communities in a 10-state region with an average population of 1,300.